

Days in A/R benchmarks tell a practice how many days of charges are sitting unpaid: total receivables divided by average daily charges. A healthy small practice runs 30 to 40 days, and anything past 50 points to a process problem. Here is what the number measures and how to move it.
What days in A/R benchmarks actually measure
Days in A/R turns a receivable balance into time. The formula is total accounts receivable divided by average daily charges, and the result is the average number of days between a service and the cash that pays for it. MGMA defines the same measure as total A/R divided by gross fee-for-service charges per day.
The denominator is where practices get tripped up. Average daily charges should come from a trailing window, usually 90 days, so one heavy surgical week does not swing the result. A practice billing about $3.3 million a year in charges runs near $9,000 a day; against $310,000 in receivables, that works out to roughly 34 days.
Days in A/R improves when collections get faster, and it also improves when the practice stops billing. If charges fall faster than receivables, the ratio flatters itself. Pair the number with charge volume before you call it progress.
Days in A/R compared with a year earlier
Source: MGMA Stat poll, July 28, 2026, 203 applicable responses.
That flat distribution is the honest headline for 2026. Medians did not move because the practices improving and the practices sliding canceled each other out. A number that holds steady at the group level can still be drifting in either direction inside one practice.
Where the benchmarks come from, and what they leave out
Two organizations set most of the reference points practices use. HFMA publishes the MAP Keys, a fixed set of revenue cycle KPIs with defined formulas. MGMA publishes survey data from thousands of medical groups, cut by specialty, ownership and practice size.
HFMA’s MAP Key FM-1 is net days in A/R. AR-6 is denial write-offs as a percentage of net patient service revenue. Both are trend indicators, not pass or fail grades. HFMA does not attach one number to them, because a result that is healthy for a cardiology group is not healthy for a solo primary care office.
| Benchmark | What it measures | Reference point | Source |
|---|---|---|---|
| Net days in A/R (MAP Key FM-1) | All receivables against average daily net patient service revenue | 30 to 40 days is the common target range | HFMA MAP Keys |
| Days of gross charges in A/R | Total A/R divided by gross fee-for-service charges per day | Varies by specialty, payer mix and ownership | MGMA DataDive |
| Denial write-offs (MAP Key AR-6) | Money written off as denials against net patient service revenue | A trend line, not a fixed pass mark | HFMA MAP Keys |
| First-submission denial rate | Share of claims denied the first time they are submitted | 7% to 8%, with under 5% reachable | MGMA |
A benchmark is a median, and a median is not a goal. By definition half of all practices sit above it. A useful target comes from your own payer mix and specialty, then gets tested against the published range rather than copied from it.
Ranges like 25 to 35 days for primary care get repeated across billing company websites with no sample size, no year and no data set behind them. A per-specialty number that does not name its source is a sales claim, not a benchmark.
What is pushing days in A/R up in 2026
When MGMA asked leaders whose days in A/R had risen what changed, payer behavior dominated the answers: slower payment, more initial denials, downcoding, records requests, prepayment audits and long appeals. Internal problems showed up too, including billing staff turnover, credentialing delays and system migrations that stalled billing for weeks.
Where practices say their revenue leaks
Source: MGMA Stat poll, January 6, 2026, 288 applicable responses. Leaders named one largest source each.
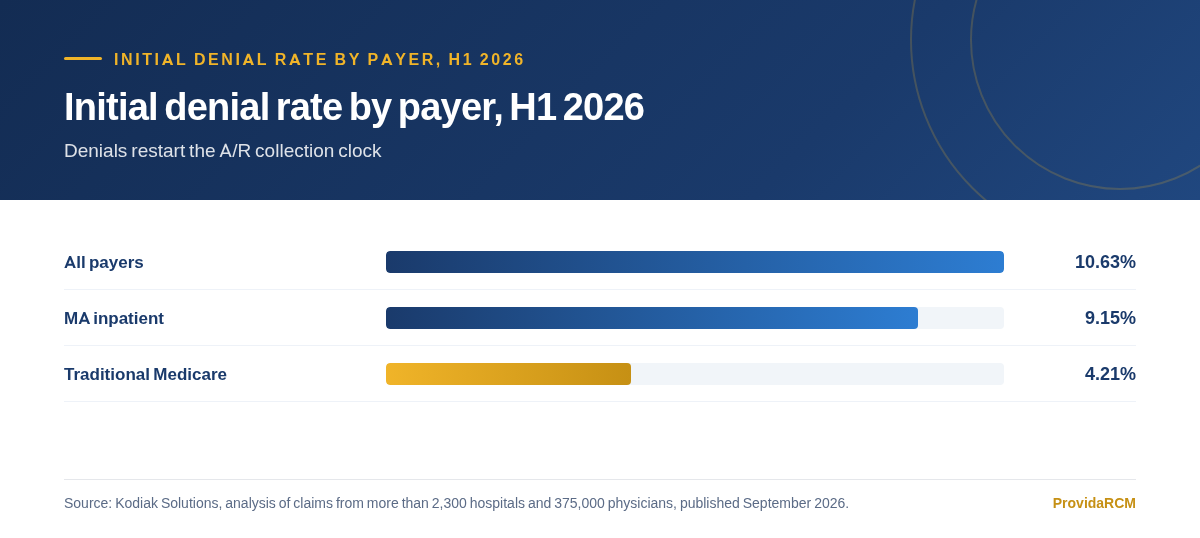
Denials restart the collection clock. A denied claim goes back to the front of a queue, and the balance ages while someone reworks it. Kodiak Solutions tracked an initial denial rate of 10.63% across more than 2,300 hospitals and 375,000 physicians in the first half of 2026, down from 12.00% a year earlier.
Initial denial rate, all payers
Source: Kodiak Solutions. 2024 is a full-year average; 2025 and 2026 are first-half figures.
The same Kodiak analysis found final denial write-offs easing to 3.07% of net revenue from 3.31%, while payer takebacks climbed to 1.57% of accounts receivable from 1.38%. Payers are paying first and recouping later. That stretches the effective collection window even when the headline denial rate improves.
Read the aging buckets behind the number
Two practices can both sit at 38 days and have completely different problems, because an average hides the distribution. Aging buckets split receivables by age: 0 to 30 days, 31 to 60, 61 to 90 and 90 or more. MGMA reports the tail as two buckets, 91 to 120 days and 120-plus days.
| Aging bucket | What it usually signals | The move |
|---|---|---|
| 0 to 30 days | Clean claims moving through normal payer turnaround | Leave it alone. Watch that the share is not shrinking |
| 31 to 60 days | Claims in adjudication or first follow-up | Confirm every account has been touched once |
| 61 to 90 days | Denials, requests for information or slow payers | Work by root cause, not by date |
| 90 or more days | Missed filing deadlines or unresolved denials | Triage by dollar value and appeal deadline today |
The direction of the 90-plus bucket is the early warning. A growing pile there usually means claims are missing filing deadlines or denials are not being worked. Medicare fee-for-service allows one calendar year from the date of service to file, per the CMS Medicare Claims Processing Manual, and a late filing has no appeal rights. Commercial windows are often shorter.
Ownership shapes the aging profile. The 2025 MGMA DataDive Financials and Operations report found physician-owned practices grew their 0 to 30 day bucket by 2 to 7 percentage points in 2024 and held 120-plus balances flat. Hospital- and IDS-owned groups went the other way: their 0 to 30 day share fell by double digits, and their 120-plus share rose 9.5 to 15.9 points.
- Run A/R aging by payer rather than in total, so slow payers surface before contract talks
- Keep insurance A/R and patient A/R on separate reports; they age for different reasons
- Trend the 90-plus bucket month over month, alongside the top-line days figure
- Flag any payer whose share of the 61 to 90 day bucket is rising two months running
How to bring the number down
The lever with the most room is charge lag, and it is the one a practice controls fully. MGMA’s guidance is to close encounters within 72 hours and post charges within two days, against a sector that commonly runs three to seven days behind. A claim that leaves late starts its payment clock late, on every single claim.
- 01
Close the encounter inside 72 hours
An unsigned note cannot be coded, and an uncoded note cannot be billed. Set the expectation with clinicians, not the billing team alone.
- 02
Post charges within two days
Charge entry lag is self-inflicted A/R. Move to same-day entry wherever the workflow allows it.
- 03
Work denials within two business days
The first touch on a denial should happen in days, not at the next aging run. Recovery odds fall as the claim ages.
- 04
Verify eligibility before the visit
Coverage and coordination-of-benefits problems become denials, and denials become aged A/R. A pre-visit check removes most of them.
- 05
Collect at the front desk
In 2024, MGMA found practices collected 72% of copayments at the time of service but only about 27% of other patient balances.
Patient balances are the slowest money in the building. A practice that takes 72% of copays up front but 27% of everything else is financing the rest itself, often for months. Clear statements and a real patient statement process move that balance off the books and shorten the average.
One MGMA respondent cut days in A/R from 67 to less than 34 after an RCM overhaul. The reported changes were operational, not exotic: new billing leadership, stronger denial management, encounters closed sooner and better front-desk collection.
What to measure every week
Days in A/R is a lagging number. By the time it moves, the cause is a month old. A weekly dashboard on the drivers catches problems while they are still cheap to fix.
| Metric | Healthy reading | Warning sign | Source |
|---|---|---|---|
| Days from visit to claim submitted | Two days or less | Past five days | MGMA |
| Share of A/R in 0 to 30 days | Rising or flat | Falling for two months | MGMA DataDive |
| Share of A/R over 90 days | Flat or falling | Any steady climb | MGMA |
| First-submission denial rate | 7% to 8%, under 5% reachable | Above 10% | MGMA, Kodiak |
Two practices at 40 days are not in the same position. One is collecting steadily and carrying a normal payer mix. The other has a 90-plus pile and a shrinking front bucket. Same score, opposite trends, different fixes.
What to ask a billing partner about your A/R
Any billing company can put a days in A/R number on a monthly report. The useful questions are about the work underneath it.
- Ask for A/R aging by payer for the last six months, not one blended total. Slow payers should be visible before contract season.
- Ask what the average time from date of service to claim submission is, and how it is measured.
- Ask how denials are worked: by root cause or by date. Date-sorted queues let high-dollar claims age.
- Ask what share of A/R sits over 90 days and what the plan is for that bucket this quarter.
- Ask how patient balances are collected and what the point-of-service collection rate is.
We do this work through AR management built on full-cycle medical billing and denial management, with eligibility verification at the front and medical coding in the middle. If you want to size your own gap first, a three-month aging review usually shows where the days are hiding.
Questions practices ask us about this
What is a good days in A/R for a medical practice?
Most published guidance puts a healthy range at 30 to 40 days for a physician practice, with strong performers under 30. HFMA publishes the metric as net days in A/R, and MGMA reports it by specialty, ownership and practice size. A solo primary care office should sit near the low end, while a surgical or oncology practice with higher charges and slower payers may run higher without being in trouble.
How do you calculate days in A/R?
Divide total accounts receivable by average daily charges. Average daily charges come from a trailing window, usually 90 days, so a single heavy week does not distort it. MGMA states the formula as total A/R divided by gross fee-for-service charges per day. Run it on a consistent basis each month; the direction matters more than any one number.
What do the A/R aging buckets mean?
The buckets split receivables by age. The 0 to 30 day bucket is normal payer turnaround, 31 to 60 days is adjudication and first follow-up, 61 to 90 days is usually denials or slow payers, and 90 or more days is missed deadlines and unresolved denials. MGMA reports the tail as 91 to 120 days and 120-plus days. A growing 90-plus bucket is the clearest sign of a process problem.
Why did our days in A/R rise if our denial rate went down?
Denial rate is only one input. Kodiak Solutions found that in the first half of 2026 initial denials eased while payer takebacks, money recouped after a claim was paid, rose to 1.57% of accounts receivable from 1.38%. Charge lag, patient balances and post-payment clawbacks all add days. A falling denial rate sitting next to rising takebacks can still mean a slower cycle.
What is the fastest way to lower days in A/R?
Close charge lag first. MGMA’s guidance is to close encounters within 72 hours and post charges within two days, against a sector that commonly runs three to seven days behind. Every day between the visit and the claim is a day added to A/R before the payer is even involved. Working denials within two business days is the next fastest lever.
How often should we run an A/R aging report?
Monthly is the minimum, and weekly is better for the drivers. Run the aging by payer rather than in total, and keep insurance and patient balances separate. Trend the 90-plus bucket month over month. MGMA’s advice is to bring payer-level aging reports to budget and contract talks, because they show which payers are consistently slow and how much money is tied up with each.
Want this fixed in your practice?
We run full-cycle billing, coding, credentialing and denial work for practices across the country. Send us a few months of claims and we will show you where the money is going.
Book a free billing review- MGMA Stat, Days in A/R holds steady for most practices, but payer pressure persists in 2026, July 2026. mgma.com/mgma-stat/days-in-a/r-holds-steady-for-most-practices-but-payer-pressure-persists-in-2026
- MGMA Stat, Detecting and fixing leaks across the revenue cycle, January 2026. mgma.com/mgma-stat/detecting-and-fixing-leaks-across-the-revenue-cycle
- MGMA, A/R, collections, payer mix (days in A/R and aging bucket formulas). mgma.com/cost-recv-a-r-collections-payer-mix
- HFMA MAP Keys, industry standard revenue cycle KPIs (AR-6 denial write-offs). hfma.org/data-and-insights/map-initiative/map-keys
- Kodiak Solutions, Revenue Cycle Intelligence benchmarking reports, 2026. kodiaksolutions.io/internal/benchmarking_reports
- TechTarget, Insurers deny less just to claw back more later, Kodiak analysis, September 2026. techtarget.com/revcyclemanagement/news/366651012/Insurers-deny-less-just-to-claw-back-more-later-analysis
- CMS Medicare Claims Processing Manual, Chapter 1, timely filing and receipt date. cms.gov/regulations-and-guidance/guidance/manuals/downloads/clm104c01.pdf