A clean claim rate is only as good as its definition. Two practices can both report 97 percent while one counts claims that cleared its own scrubber and the other counts claims a payer paid on first submission, with no corrected claim and no appeal. Same phrase, different arithmetic, no comparison.
Two practices can both report 97 percent clean. They are counting different things.
The clean claim rate has no single agreed meaning. One practice computes it inside its billing software, as the share of claims that clear the scrubber without a human touching them. Another computes it from the 835 remittance advice, as the share of claims the payer adjudicated without asking for anything. Both get called the clean claim rate.
That gap matters because the number gets used as a report card. A practice hires a billing service, watches the rate rise, and asks why cash did not follow. A manager told to hit 95 percent cannot say which number the goal means.
How medical groups described their denial rates in 2024
Source: MGMA Stat poll, March 5, 2024, 235 applicable responses.
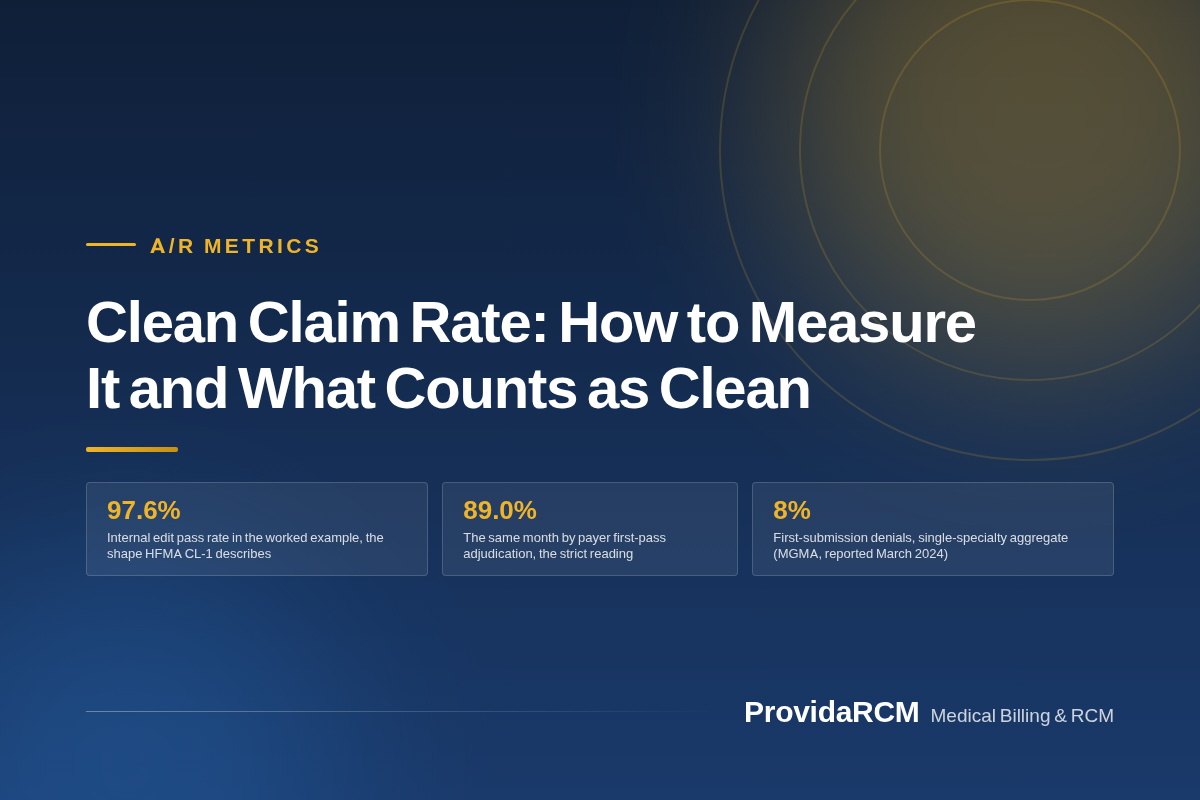
That is the backdrop. MGMA’s benchmarking puts first-submission denials for single-specialty practices at 8 percent, a figure its 2023 DataDive Practice Operations data set reported as unchanged from 2019 (MGMA Stat, March 2024). It measures denials rather than clean claims, and it measures them on first submission.
Two practices can report the same clean claim rate and be describing different events. The rate is a definition plus arithmetic, and you control the definition.
What the HFMA MAP Keys clean claim rate actually specifies
HFMA publishes 29 MAP Keys across five groups, and one of them is a clean claim rate. It carries the number CL-1. The definitions document supplies the equation, the inclusions, the exclusions and the data source. No target comes with it.
CL-1 reads this way: claims that pass edits requiring no manual intervention, divided by claims accepted into the claims processing tool. Both figures come from that tool, which is your scrubber or billing system, not the payer.
The exclusions are the part people skip. Print and mail claims come out. Claim edits held for human intervention come out. Claims never sent into the processing system come out, so claims filed straight to a payer portal sit outside the metric. The result describes software and the data feeding it. HFMA’s definitions page carries the full wording.
| Element | CL-1 Clean claim rate | AR-5 Remittance denial rate |
|---|---|---|
| Numerator | Claims passing edits with no manual intervention | Claims denied at claim level on the remittance |
| Denominator | Claims accepted into the claims processing tool | Total claims remitted in the same period |
| Data source | Claims processing tool or scrubber | 835 files and paper remittances |
| Unit counted | Each 837 claim | Each claim, never line items |
| Appeals and patient balances | Outside the metric | Appeal denials in, patient responsibility out |
| Target published | None in the definitions document | None in the definitions document |
Vendor pages fill the silence. Scintillate RCM publishes a revenue cycle KPI table that lists a clean claims rate target of 95 percent or better and states that HFMA cites 98 percent for high performers. HFMA’s MAP Keys definitions document prints no target value for CL-1. Treat a percentage credited to HFMA without a document reference as the vendor’s number.
The same caution applies to a federal figure that gets quoted constantly. Medicare Advantage plans must pay 95 percent of clean claims within 30 days and owe interest after that (42 CFR 422.520). That 95 is a payment deadline for a plan, not a quality target for a practice.
There is a payer-side key in the same set, and it is not the clean claim rate. AR-5, remittance denial rate, divides claims denied by total claims remitted and takes its data from the 835. It counts initial and appeal denials together and excludes patient responsibility.
An internal edit rate is a software metric, not a payer acceptance rate
A scrubber edit and a payer edit are different events. The scrubber applies rules your team configured: a missing referring provider, a diagnosis that does not support the procedure, a modifier that looks unusual for the specialty. The payer applies its own edits, its own medical policy and its own adjudication system.
Medicare writes the distinction into its own manual. The Medicare Claims Processing Manual, Chapter 1, Section 80.2, defines a clean claim as one that does not require the contractor to investigate or develop anything external to the Medicare operation on a prepayment basis, and adds that clean claims must be filed inside the timely filing period. Section 80.2.1.1 sets the ceiling: 30 calendar days from receipt to pay or deny.
Claims that fail that test are not clean, and Medicare says so plainly. Section 80.3.3 calls them other-than-clean and allows 45 calendar days. Those two clocks are the clearest public statement of what acceptance means: the payer examined the claim and did not have to contact anyone. An internal 97 percent against a payer acceptance of 94 percent is three points of claims your software approved.
A second filter applies to any report built on denial codes, and the code list has to be live. A dashboard that tallies CO-15 is working from a code X12 deactivated on 1 May 2018, when CO-197 became the code for an absent authorization. A retired code will not move the headline rate much, but it hides which denials are worth fixing. The current X12 list marks each code current or deactivated.
Is the numerator made of claims that left your building, or claims the payer accepted? If nobody can answer that without opening the report definition, the number cannot be compared to a benchmark or to last year.
Four counting decisions that change the number
Before you pick a clean claim rate, settle four questions. Each one moves the number, and none is right or wrong until you write it down.
| Decision | If you count it | If you do not | Effect on the rate |
|---|---|---|---|
| A payer edit returns it | Not clean, though the scrubber passed it | Out of the numerator, resubmission counted alone | Counting it lowers the rate, as the payer saw it |
| A claim pays on appeal | Clean, because the money arrived | Not clean, with appeal wins tracked separately | Counting it adds points and hides the rework |
| Denominator choice | Claims | Billed charges | Charges weight one large denial heavily |
| A corrected claim goes out | An extra claim | The original claim once | Inflates the denominator and flatters the rate |
One month, two answers: clean by claim count and by charges
Source: worked example in this article, 5,000 claims and $1,850,000 in billed charges, $212,000 written off.
The claims-versus-charges choice is the quietest and the most expensive. A month with 190 write-offs out of 5,000 claims reads like a 3.8 percent problem. If those claims carry $212,000 of the $1,850,000 billed, the same month is an 11.5 percent problem by dollars. The claim count measures rework. The dollars measure cost.
The corrected claim question decides whether your denominator is stable. When every resubmission creates a new record, your monthly claim count drifts with your error rate, and the month you fix the most problems becomes the month the denominator grows fastest. A rising denominator reads as improving performance when nothing improved.
Whichever answers you choose, they have to hold still across months. A metric whose definition loosens in the month the number looks bad is not a metric.
One month, five thousand claims: the arithmetic
Numbers make the argument faster than adjectives. Take a month with 5,000 claims and $1,850,000 in billed charges, then walk the claims through four gates.
| Gate | Claims | Rate | What it measures |
|---|---|---|---|
| Submitted in the month | 5,000 | 100% | The denominator, counted by claim |
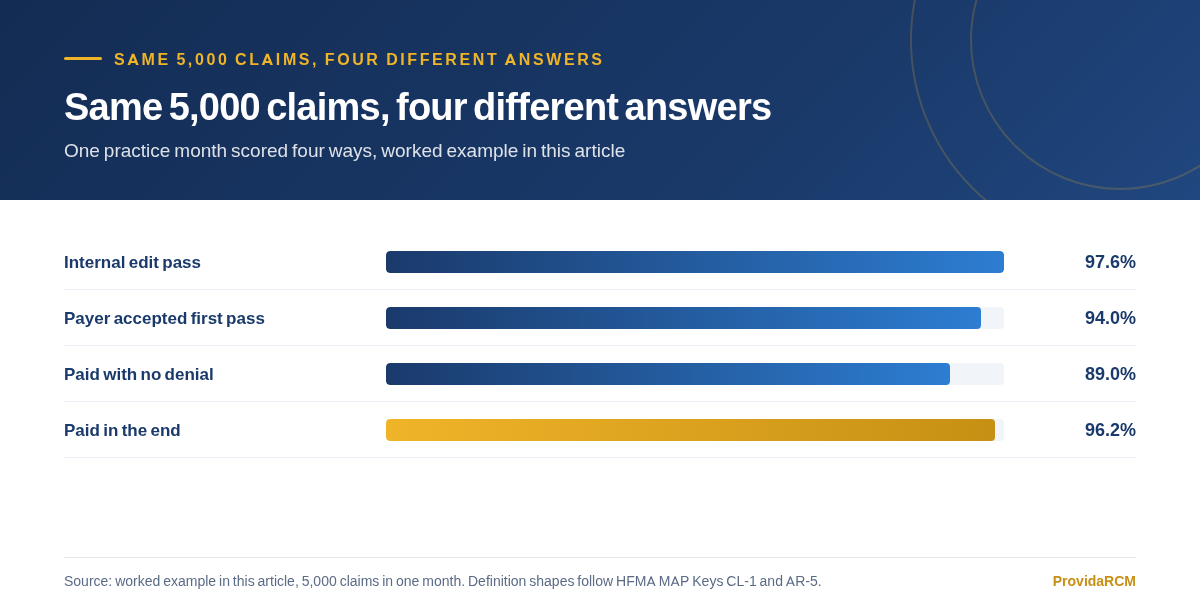
| Passed internal edits, no manual touch | 4,880 | 97.6% | Scrubber configuration and registration data |
| Accepted by the payer on first submission | 4,700 | 94.0% | Payer intake rules, before adjudication |
| Paid with no denial or resubmission | 4,450 | 89.0% | First-pass adjudication, the strict reading |
| Paid in the end, after corrections and appeals | 4,810 | 96.2% | Lifetime yield, 360 recovered claims |
| Written off | 190 claims, $212,000 | 3.8% of claims, 11.5% of charges | Revenue nobody sees again |
Of the 5,000 claims, 300 came back rejected at payer intake and were corrected and resubmitted, of which 260 were paid. The payer accepted 4,700 on first submission, and 250 of those came back denied on first adjudication. Appeals overturned 100. The other 150, plus 40 never rescued from the resubmission pile, became the write-offs.
Where the 5,000 claims ended up
Source: worked example in this article, 5,000 claims in one month.
Put the four answers side by side: 97.6 percent, 94.0 percent, 89.0 percent, 96.2 percent. All four come from the same 5,000 claims in the same 30 days. Two practices reporting the first and the third are almost nine points apart on paper and identical in reality.
The clean claim rate definition to adopt, in one paragraph
The wording below is the one worth copying. It is written for the payer side, because the payer side decides whether you get paid, and it will read lower than most dashboards show.
Our clean claim rate is the share of claims submitted in a calendar month that the payer accepts and pays on first adjudication, with no corrected claim and no appeal, counted by claim number against the date the claim was first submitted. A claim a payer returns for missing or wrong data counts against the rate, even when our scrubber passed it. A claim we correct and resubmit is counted once, against its original submission. A claim we win on appeal belongs in a separate appeal overturn rate.
Two companion metrics keep it honest: the appeal overturn rate, which shows how much denied money comes back, and denial write-offs as a share of net patient service revenue, which HFMA tracks as AR-6. A rate that falls while write-offs fall is a measurement change. One that falls while write-offs rise is a problem.
- Print the definition on page one of the monthly report, above the number
- Freeze the denominator at the claim level, not charges and not line items
- Anchor every claim to its first submission date and count it exactly once
- Report the rate by payer group, because a blended figure hides the payer eating your margin
- Keep appeal wins in their own metric
Denial codes belong beside the rate, not inside it. When a denial report names a code, that code has to be live, which is why the CARC and RARC reference is worth keeping open while you build the taxonomy.
Comparing month to month and payer to payer
A definition that works for one month is not much of a definition. Comparison needs a few mechanical rules, and they are boring on purpose.
| Rule | Why it matters | The failure it prevents |
|---|---|---|
| Anchor the month to the original submission date | A claim can go out in March and adjudicate in May | Denominators that shift with payer speed |
| Count at the claim level | A five-line claim is still one claim | Rates that move when coding patterns change |
| Split the rate by payer group | Payers apply different edits and denial codes | One bad payer hidden in a healthy blend |
| Report first-pass and final outcomes separately | They answer different questions | A strong appeals team flattering the front end |
| Put charge-weighted write-offs beside the claim count | A small claim and a large claim are not interchangeable | A 3.8 percent problem read as a revenue problem that size |
The payer split is where the useful work sits. Medicare’s rules are public: 30 days to pay or deny a clean claim, 45 for other-than-clean claims, and a payment floor that holds electronic claims 13 days and paper claims 28 (Noridian’s clean claims page). Commercial front-end edits are published nowhere, so you learn them from rejections. Rank acceptance by payer over three months and the pattern stops being a mystery.
Run it payer by payer and a second question surfaces: is the loss at the front end, in coding, or in the appeals queue. Our denial management services exist because that question has three answers and three owners, and a full-cycle medical billing team sees all of them at once.
If the comparison work is more than the practice can carry, that is a normal finding. Uncounted denial work is one of the quietest reasons a days in A/R number drifts upward, and a denial management workflow with an owner per category turns a monthly report into a queue. A/R management reporting starts there.
Questions practices ask us about this
What is a clean claim rate?
It depends on who is counting, and that is the honest answer. HFMA’s MAP Keys define the clean claim rate, CL-1, as claims that pass edits requiring no manual intervention divided by claims accepted into the billing system. Most practices and billing vendors use a payer-side version instead: claims a payer accepts and pays on first submission. The two are not interchangeable.
What clean claim rate should a practice target?
No national body publishes a target for it. HFMA defines CL-1, including its inclusions and exclusions, and prints no target value. MGMA publishes first-submission denial rates rather than clean claim rates, at 7 to 8 percent for single-specialty practices across the past four years, and its 2025 Financials and Operations report says targeted process fixes can push that below 5 percent.
Does a claim that pays after an appeal count as clean?
Only if you decide it does, and the decision has to be made before you report the number. Counting appeal wins as clean raises the headline rate, sometimes by several points, and hides the rework that produced them. The cleaner habit is to report two figures: the share paid on first adjudication, and a separate appeal overturn rate. Recovery then shows up as recovery.
Should a claim stopped by a payer edit count against our rate?
If the number is meant to describe payer acceptance, yes. A payer-side edit is the payer saying the claim as submitted was not processable or not payable, which is precisely the event a payer-side clean claim rate is designed to catch. An internal edit rate counts neither event, which is how an internal 97 percent and a payer acceptance of 94 percent can both be true in one month.
Do we count claims or charges?
Claims for the rate, charges alongside it. Claim counts make the number comparable across payers and months, and they match how HFMA defines both CL-1 and AR-5, which count claims rather than line items. Charges tell a different story, because a few high-dollar denials can leave the claim count healthy while a much larger share of the dollars leaks out.
Why do two billing companies report different clean claim rates for the same practice?
Because the numerator is doing different work in each one. One company may count claims that cleared its own scrubber, another may count claims the payer accepted, and a third may count anything that eventually paid. Each is arithmetically correct. Ask for the numerator, the denominator, the data source and the date anchor in writing.
Want your clean claim rate measured honestly?
We run full-cycle billing, coding, credentialing and denial work for practices across the country, and we report the payer-side clean claim rate with the definition in writing.
Book a free billing review- HFMA MAP Keys, CL-1 Clean Claim Rate and AR-5 Remittance Denial Rate definitions. hfma.org/data-and-insights/map-initiative/map-keys
- CMS, Medicare Claims Processing Manual, Chapter 1, Section 80.2 Definition of Clean Claim. cms.gov/regulations-and-guidance/guidance/manuals/downloads/clm104c01.pdf
- eCFR, 42 CFR 422.520, Prompt payment by MA organization. ecfr.gov/current/title-42/chapter-IV/subchapter-B/part-422/subpart-K/section-422.520
- MGMA Stat, Strategic improvements in your RCM to reduce your practice’s claim denials, March 6, 2024. mgma.com/mgma-stat/strategic-improvements-in-your-rcm-to-reduce-your-practices-claim-denials
- MGMA Stat, Days in A/R holds steady but payer pressure persists in 2026, July 30, 2026. mgma.com/mgma-stat/days-in-a/r-holds-steady-for-most-practices-but-payer-pressure-persists-in-2026
- X12, Claim Adjustment Reason Codes, current and deactivated code list. x12.org/codes/claim-adjustment-reason-codes
- Noridian Healthcare Solutions, Clean Claims – Payment/Interest, JD DME. med.noridianmedicare.com/web/jddme/claims-appeals/claim-submission/clean
- Scintillate RCM, 7 Key Revenue Cycle KPIs to Track (vendor KPI targets). scintillatercm.com/7-revenue-cycle-kpis-every-healthcare-leader-should-monitor