
AR aging buckets split open receivables by age: current to 30 days, 31 to 60, 61 to 90, 91 to 120, and over 120. Each bucket means a different thing and calls for a different move. The dollars sitting in the oldest buckets are what keep days in A/R high and the collection odds low.
The five AR aging buckets and what each one means
Every aging report answers one question: how old is the money you are still owed. A standard report sorts open receivables into five buckets by the date of service, the date billed, or the last bill date. Which date your system uses changes the picture, so confirm it before you compare one month to the next.
The cuts are current to 30 days, 31 to 60, 61 to 90, 91 to 120, and over 120. MGMA defines the same five buckets and keeps accounts turned over to collection agencies out of the total. Many systems collapse the tail into a single 90-plus bucket, which hides the difference between a claim you can still save and one that is already dead.
| Aging bucket | What it usually holds | The signal | Who owns the move |
|---|---|---|---|
| Current to 30 days | Clean claims inside normal payer turnaround | Nothing wrong yet | Leave it alone, watch the share |
| 31 to 60 days | Claims still in adjudication or waiting on a first check | A slow payer or a quiet denial | Follow-up, confirm each account was touched |
| 61 to 90 days | Denials and second requests for records | A missed first action | Denial and coding, before it ages further |
| 91 to 120 days | Claims near filing and appeal deadlines | A closing window | Senior biller, same-day action |
| Over 120 days | Claims at or past the payer deadline | Most of this is a write-off | Triage by dollar value, document the outcome |
A single bucket on its own says little. The story is in the shape of the report and in how each layer moves from one month to the next. A growing front bucket with a flat tail is healthy. A shrinking front bucket with a rising tail is not, and it will not correct itself.
What a healthy aging profile looks like
A healthy report is front-loaded. Most of the money sits in current to 30 days, each older layer holds less than the one before it, and the tail past 90 days stays thin. When the shape inverts, with more dollars aging than collecting, the collections process has stopped converting claims to cash.
A/R over 90 days, 2024
Source: Kodiak Solutions, Revenue Cycle Intelligence benchmarking, drawn from more than 2,100 hospitals and 300,000 physicians.
Those two numbers come from the same data set, which is what makes them useful. The gap is not a payer problem or a specialty problem. It is the difference between working the 90-plus pile and leaving it alone.
| Bucket | Healthy reading | What a rising share means |
|---|---|---|
| Current to 30 days | Largest share, growing or flat | Claims are not going out on time |
| 31 to 60 days | A thin layer, never the biggest bucket | First follow-up is not happening |
| 61 to 90 days | Small and shrinking | Denials are not being worked |
| 91 to 120 days | Single digits | Deadlines are closing on live claims |
| Over 120 days | Near zero | Revenue already lost |
No single number defines healthy for every practice. HFMA’s MAP Keys define net days in A/R and the surrounding metrics but do not attach one target to them, because a solo primary care office and a surgical group carry different payer mixes. MGMA reports the buckets by specialty and ownership instead.
Ownership alone moves the aging. In 2024, physician-owned practices grew the share of A/R in the 0 to 30 day bucket by roughly 2 to nearly 7 percentage points and held the 120-plus layer flat, according to the 2025 MGMA DataDive Financials and Operations report. Hospital- and IDS-owned groups moved the other way, with the 0 to 30 day share falling by double digits and the 120-plus share rising 9.5 to 15.9 points.
How the 90-plus bucket drives days in A/R
Days in A/R is total receivables divided by average daily charges. Every unpaid dollar stays in the numerator until it is collected or written off, and the oldest dollars sit there the longest. MGMA states the gross version as total A/R divided by gross fee-for-service charges per day. HFMA’s net version uses net A/R over average daily net patient service revenue.
A claim that pays in 25 days leaves the receivable quickly. The same dollar that ages to 200 days inflates days in A/R for months. That is why two practices can sit at 38 days with opposite trends: one is collecting on schedule, and the other is carrying a 90-plus pile the average is hiding.
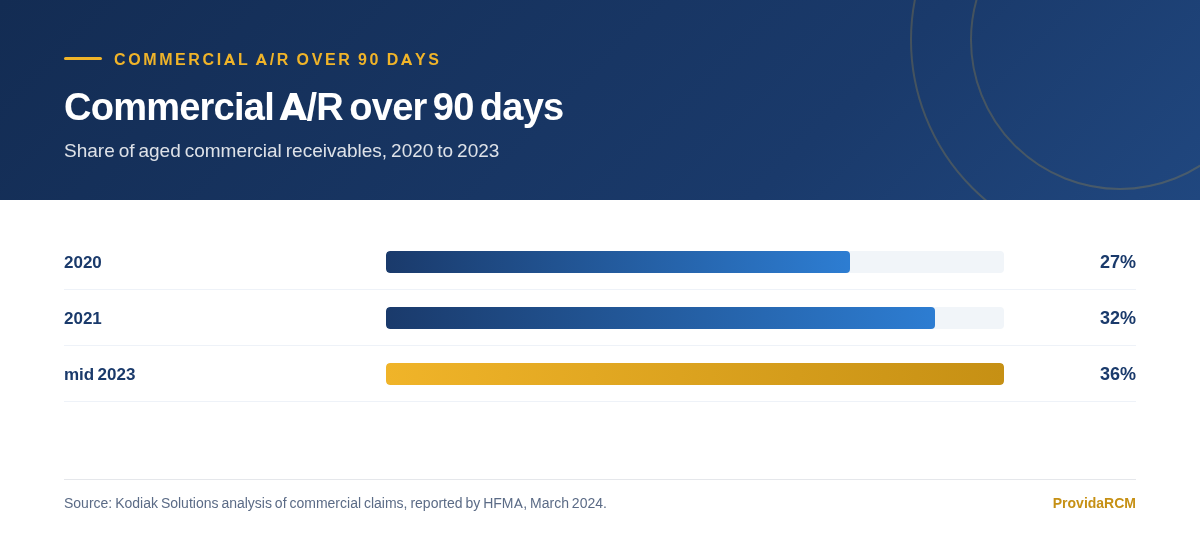
Kodiak’s own analysis ties the growth in the tail to denials. A denied claim restarts its clock and ages while it is reworked, so a rising 90-plus share is usually a denial problem wearing a collections disguise. The fix lives upstream, in the front end and the appeal queue, not in a month-end report.
Medicare fee-for-service claims must be filed within one calendar year of the date of service, per the CMS Medicare Claims Processing Manual. A claim filed after that brings CARC 29, the time limit for filing has expired, and it usually carries no appeal rights. Commercial and Medicaid windows are often shorter.
What to do in each bucket
The action changes with the age. Working a current to 30 day claim is waste. Ignoring a 91 to 120 day claim is a write-off you chose. Here is the move each layer calls for.
- 01
Current to 30 days: leave it, watch the share
These claims are doing what they should. Track the share week over week so a slow payer or a submission bottleneck shows up here first.
- 02
31 to 60 days: touch every account once
No claim should sit here unworked. Run a status check, find the pended and denied ones, and route each to the right queue.
- 03
61 to 90 days: work the root cause
This bucket is where recovery is still cheap. Sort by denial reason, fix the cause, and resubmit. It is the layer to attack first.
- 04
91 to 120 days: escalate by deadline
Collectability is dropping and windows are closing. Pull each account’s filing and appeal deadline, and put today’s action on the ones nearest to closing.
- 05
Over 120 days: recover or write off with a reason
Split the layer into still-recoverable and already-dead. Work the first. Write off the second with a reason code so dead dollars stop masking the live ones.
The 61 to 90 day bucket carries the most recoverable money, which is why it gets the most attention. Dollars that reach 120 days are harder and more expensive to collect, and some are already past their deadline. Prevention beats recovery on every one of these layers.
Patient balances age on a different clock
Insurance A/R and patient A/R do not age the same way, so folding them into one bucket hides what is going on. Insurance balances age on the payer’s adjudication and appeal schedule. Patient balances age on your statement and follow-up cadence, and they are the slowest money in most practices.
Point-of-service collection rate, 2024
Source: MGMA Stat, citing 2024 practice data.
That 72 against 27 split is the reason patient balances pile into the oldest buckets. A balance that was not collected at the desk becomes a statement, then a second statement, then a phone call, then an aged account. A clearer patient statement process and a real point-of-service routine keep that money out of the tail.
Split patient A/R from insurance A/R on every aging report. They fail for different reasons and get fixed by different people. A blended 90-plus number tells you there is a problem without telling you which one.
What to ask a billing partner about your aging report
Any billing company can put a days in A/R number on a monthly report. The aging report underneath it is where the actual work shows up.
- Ask for A/R aging by payer and by bucket for the last six months, not one blended total.
- Ask how the report ages claims: by date of service or by last bill date. Re-billing can reset the clock and hide old claims.
- Ask what share of A/R sits over 90 days and what the plan for that bucket is this quarter.
- Ask how the 61 to 90 day bucket is worked and who owns the deadline calendar.
- Ask how patient balances are collected at the point of service and how fast.
We do this work through AR management built on full-cycle medical billing and denial management, with prior authorization and eligibility verification at the front. The days in A/R benchmarks article covers how the headline number is built. If you want to size your own gap first, a three-month aging review shows where the days are hiding.
Questions practices ask us about this
What are A/R aging buckets in medical billing?
A/R aging buckets group unpaid claims by how long they have been outstanding. The standard set is current to 30 days, 31 to 60, 61 to 90, 91 to 120, and over 120 days. The report shows how much you are owed and how old the money is, which payer or workflow is behind the delay, and which accounts still have time to be saved.
What percentage of A/R should be over 90 days?
No single published number fits every practice. HFMA’s MAP Keys define the metrics but do not attach one target to them. Kodiak’s 2024 data put the average organization at 35.9% of A/R over 90 days and its top performer at 22.5%. Track the direction of your own tail and compare it with your specialty rather than chasing one figure.
How do A/R aging buckets affect days in A/R?
Days in A/R is total receivables divided by average daily charges. Every unpaid dollar stays in the numerator until it is collected or written off, and dollars in the oldest buckets stay there longest. A claim that pays in 25 days leaves the calculation quickly. A claim that ages to 200 days holds the number up for months, so the 90-plus tail drives days in A/R more than any other bucket.
What should we do with claims in the 61 to 90 day bucket?
Work them first. This bucket holds the most recoverable money because the claims are usually denied once and still inside their filing and appeal windows. Sort the accounts by denial reason, fix the cause, and resubmit or appeal before they age into 91 to 120 days. Claims that cross into the oldest buckets are harder and more expensive to collect.
Why do patient balances age faster than insurance A/R?
They age on a different clock. Insurance balances wait on payer adjudication and appeals. Patient balances wait on your statements and follow-up. MGMA found practices collected 72% of copayments at the time of service in 2024 but only about 27% of other patient balances, so much of that money is never collected up front and drifts into the older buckets.
What does CARC 29 mean on aged claims?
CARC 29 means the time limit for filing has expired. It is the payer saying the claim arrived after its filing deadline, and it usually carries no appeal rights. Medicare fee-for-service allows one calendar year from the date of service, per the CMS Medicare Claims Processing Manual, and commercial windows are often shorter. Once CARC 29 lands, the balance is usually a write-off.
How often should we review A/R aging?
Monthly at the least, and weekly on the drivers. Run the report by payer, keep insurance and patient balances separate, and trend the over-90 share month over month. The dollar total tells you how much is at stake. The direction of each bucket tells you whether the work is keeping up, which the blended days in A/R number cannot show on its own.
Want this fixed in your practice?
We run full-cycle billing, coding, credentialing and denial work for practices across the country. Send us a few months of claims and we will show you where the money is going.
Book a free billing review- HFMA MAP Keys, industry standard revenue cycle KPIs (FM-1 net days in A/R). hfma.org/data-and-insights/map-initiative/map-keys
- MGMA, A/R, collections and payer mix (aging bucket and days in A/R formulas). mgma.com/cost-recv-a-r-collections-payer-mix
- MGMA Stat, Days in A/R holds steady for most practices, but payer pressure persists in 2026, July 2026. mgma.com/mgma-stat/days-in-a/r-holds-steady-for-most-practices-but-payer-pressure-persists-in-2026
- Kodiak Solutions, Revenue Cycle Intelligence benchmarking, May 2025 quarterly report (true A/R days greater than 90). kodiaksolutions.io/internal/benchmarking_reports/kpi_benchmarking_may_quarterly
- HFMA, Battle of the bots (Kodiak Solutions analysis of aged commercial A/R over 90 days). hfma.org/revenue-cycle/denials-management/health-systems-start-to-fight-back-against-ai-powered-robots-driving-denial-rates-higher
- CMS Medicare Claims Processing Manual, Chapter 1, timely filing limits. cms.gov/regulations-and-guidance/guidance/manuals/downloads/clm104c01.pdf
- X12, Claim Adjustment Reason Codes (current list). x12.org/codes/claim-adjustment-reason-codes